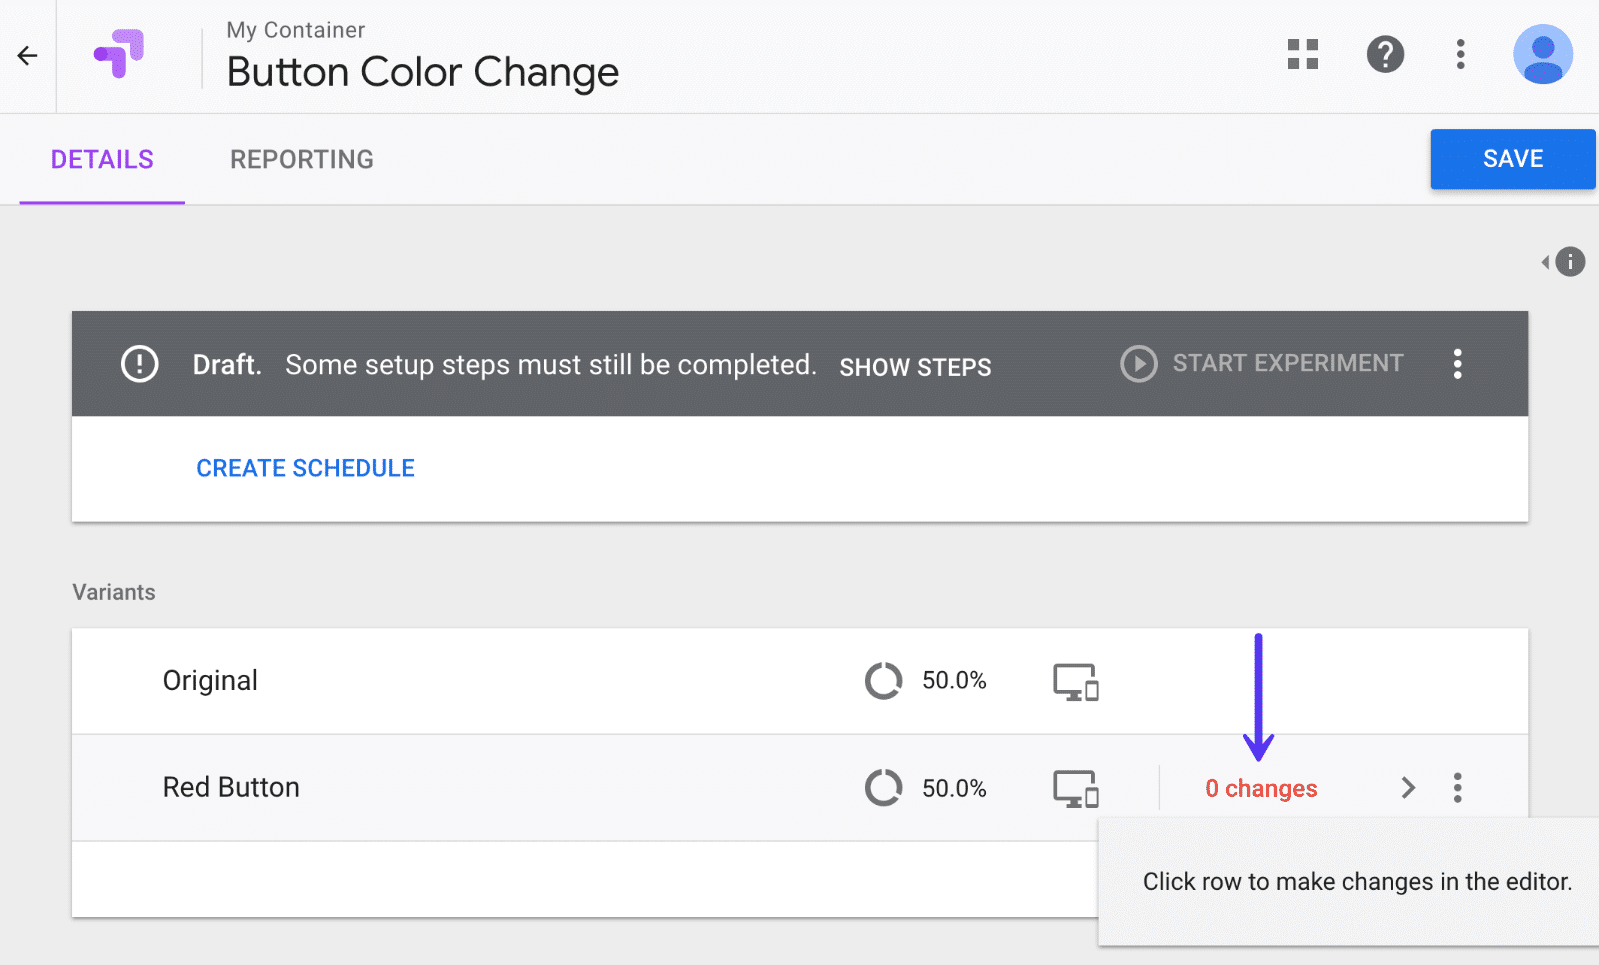
Google Optimize is a free Google Analytics 360 testing platform, with which you can create experiments and A / B tests, to improve the conversion rate [CRO] of your website.
Optimization is directly linked to conversion. Google Optimize is the perfect platform to test different versions of your website elements and designs and, based on the results, design your website to improve your conversion goals.
This platform is the evolution of Google Analytics experiences, which were part of behavioral reports and which were more complex to create and more limited in their functionality.
What is Google Optimize and how does it work?

Google Optimize is a tool that connects to your website and allows you to create experiments and A / B tests of different elements of your website. You can play with different formats and designs, without having to duplicate your page. You can test and measure the performance of each of them, based on the behavior of users who visit your website.
The platform allows you to optimize your landing pages, correct usability, and web architecture. It helps you improve user interaction with forms, content, downloads, calls to action, improve conversion landings, and more.
Google Optimize gives you immediate results from your experiments, so you can measure which version works best. It integrates seamlessly with other Google 360 apps and allows you to evaluate your marketing campaigns from multiple platforms.
Installation and activation of Google Optimize, step by step
To install Google Optimize, you need to do some preliminary steps:
- Create a Google Analytics account
- Using the Google Chrome browser
- Create an account in Google Tag Manager
- Create a Google Optimize account
- Install the Google Chrome Optimize extension on your computer
Please note that you should always open accounts in Google Tag Manager and Google Optimize with the same email account that you linked to Google Analytics, for all three platforms to be supported.
You can activate Google Optimize in two ways: with HTML code or through the Google Tag Manager.
Install Google Optimize with HTML code
You can install it by adding a piece of HTML Optimize code, which is an extra line added to Analytics, and loads the Optimize container in the right sideband, by clicking Install Optimize:
Install Google Optimize with Google Tag Manager
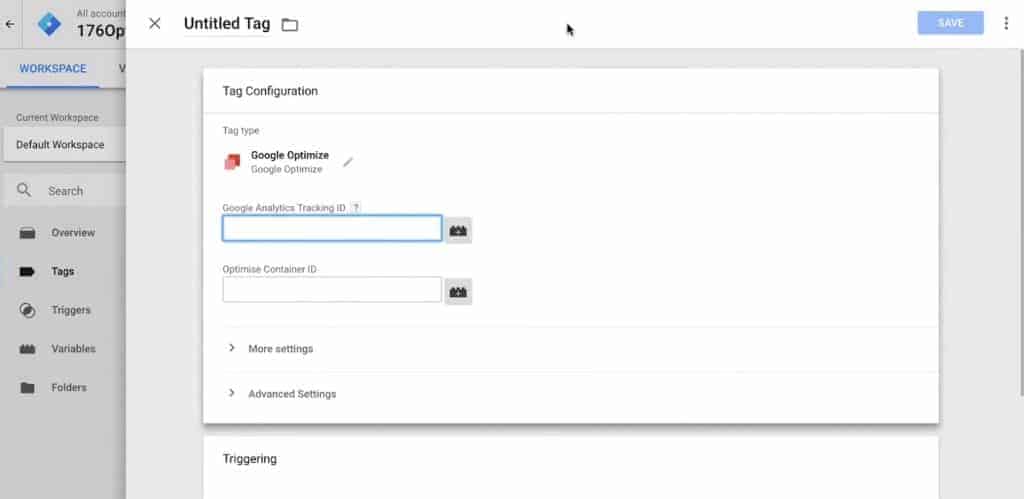
We also recommend that you install Google Optimize, once you have installed and activated the Google Tag Manager. Remember that your version of Analytics and Tag Manager are compatible (if they are recent accounts, they should be).
This will allow you to synchronize the three applications: Google Analytics, Google Tag Manager, and Google Optimize. This allows you to perform the more precise measurement, by adding tags and triggers from Google Tag Manager, which will expand the possibilities to measure your experiences and A / B tests with Google Optimize.
Previously, you will need to link Google Tag Manager to Google Analytics. You will see that it is very simple: just add a tag in the Tag Manager of Google Analytics, choose to create a new tag, and choose the one from Universal Analytics. This tag is pre-configured in your Tag Manager container.
Once the label is created in your Tag Manager container, copy and paste the Analytics Tracking ID (UA) and activate it as a page view. This will record all visits to your website on both platforms.
Once you have linked Google Analytics and Google Tag Manager, you need to create a new tag in Tag Manager that includes your Google Optimize ID (starts with the letters GTM). Activate it, sequencing it after Google Analytics, so that your visits and user behavior on both platforms are recorded and results can be measured more accurately.
When linking platforms, you should use the Analytics and Optimize labels as constant variables to make it easier to keep the labels consistent and keep track of different actions, experiences, and goals.
How to verify your installation of Google Optimize
Once Google Optimize has been installed in one of the two directions (you should only choose one), the platform offers you a check and correspondence table.
So you can start performing and measuring your tests and experiments. The tool checks all the steps and indicates if any of them are not working so that you can fix them.
Benefits of creating experiences with Google Optimize
Google Optimize has many advantages in terms of use, integration with Google Analytics, Google Tag Manager, and other Google 360 platforms. You can create experiments with different versions of your website, without having to create replicas of your landing pages and get immediate results.
These are other advantages:
Google Optimize is free and easy to use
Besides being a free tool, Google Optimize has an interface very similar to all Google Analytics 360 applications, which makes it very intuitive and easy to use. If you are already familiar with Google Analytics or Google Tag Manager, you can handle it very easily.
Google Analytics integration
It integrates seamlessly with Google Analytics, so you can create tests and measure the micro and macro targets you created in Google Analytics and measure the results (in the Behavioral Reports> Experiments section).
Real-time analysis with Google Optimize
Google Optimize provides you with behavioral analysis and reports from the first minute of the experience. So you can see the daily evolution of each experience and know which one works best based on dates or days of the week.
Synchronization and hypothesis
Google Optimize allows you to synchronize different tests and create hypotheses of your experiments to better track the results and the evolution of the experiments.
You can perform several experiments at the same time with Optimize
Although the technical term is the A/B test, you can create versions A, B, C, D, etc. of your experiences and split the traffic into equal percentages or customize them, if you want to make some more relevant than others. You can combine and do over 100 experiments at a time with a single count and see how each one works.
Google Optimize allows you to test all elements of your website
You can experiment and use different versions with each of the elements of your website: titles, images, text, buttons, forms, call to action, etc. You can even change the order, color, or size of each one to see and measure the behavior of users who visit your website.
Users only see one version of each experience in Optimize
A big advantage is that when you create an experience, and it has multiple versions of the design, color, size, etc., users who visit your website only see one version of the element in question. , therefore, it is not surprising to see changes in design, format, image, or content.
As long as you don’t delete your cookies, Google Optimize will show you the version of the experience that you saw on your first visit.
Experiments and A/B testing with Google Optimize for all subdomains of your website
It allows you to easily intervene and vary not only the home page but also each of the domains and subdomains of your website, the landing pages, the landing pages of your organic or paid campaigns, etc.
Google Optimize results in reports and graphs
Campaign results reports provide you with different metrics and graphs that allow you to view and evaluate your experiences from different angles.
Types of tests you can perform with Google Optimize
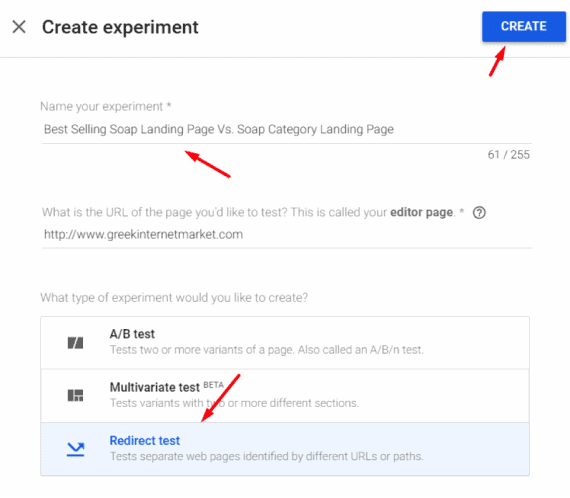
Google Optimize offers several types of experiences that you can customize, design, and tailor to the needs and goals of your brand or website.
Here are the 4 main types of experiences you can create:
Tests or A/B tests
Also known as A/B/ n testing, A/B testing is the most common experience you can create with Google Optimize. It consists of creating one or more variations of the same element of your website: a button, a title, an image, a sentence, the color or the copy of a call to action, etc.
Although it’s called an A / B test, you can create a lot of variables and see which one works best for user interaction. You can make as many changes as you want to the different variables and version B can be completely different from version A.
Multivariate or TMV tests
Multivariate testing (TMV), allows you to test with changes in different elements of the web at the same time. You can radically change in each version the design, the placement of the elements, the order, the color, the text, the typography, etc.
The test identifies the most effective variants and combinations of each element. This way, you can see which ones are performing best based on the interactions and conversions that users have made in the different versions of your website.
Redirection test (s)
Redirection testing, also known as URL splitting testing, is very similar to A / B testing, but with target pages, which you can edit and design in very different ways.
In these tests, the variants are identified by the target URL and allow you to see which design works best.
Personalization test (s) (currently in beta)
The Personalization Test is the latest update to Google Optimize. This is a set of changes that you can make to your site but targeted to a specific group of visitors who meet certain requirements.
Unlike experiments, you can implement customizations permanently and without variable options.
Customizations are a unique set of changes that are shown to users who meet certain targeting requirements, such as by location, by type of traffic, that users from Google Adwords ads see a different version of the site than organic traffic, etc..
Create experiments and A/B tests with Google Optimize
Once installed and activated, it is very easy to create experiments with Google Optimize. Once you’ve decided on the type of test you want to create and have developed the goals, description, and hypothesis to develop, you can begin to create the changes you want and feel appropriate.
Create goals and assumptions in Optimize
Once you have selected the type of test, you create or associate the objectives. Remember that you can link Google Optimize tests to Google Analytics objectives (transactional or not). You can also create hypotheses (the platform allows you to describe them with a maximum of 5000 characters).
Describing the objectives and assumptions helps you explain, see the evolution and analyze their development. It is strongly recommended to describe them well to be able to follow the changes. If you are working in a communications team, this is even more true, as it will allow you to better explain all actions and results.
To edit and create the variables, click on the changes and simply select the item you want to change. A pop-up window will then appear with an identical version of your website, telling you what you can change: background, typography, size, color, design, location, etc.
Google Optimize creates a viewport with the name of the variable you’re changing, where you can save your changes or roll back if you’re not happy.
Create variables in Google Optimize tests
Once you are done editing items and changes, in your Google Optimize tests, you save this version and can create a new one to produce new changes. When you’ve created all the versions of your experience, you assign the amount of traffic, equal or not, to each version of your website. You save and start your experience.
Your experience will be saved with the number of variables you want and will be ready to be activated or scheduled to be activated on the date and time you decide, for example, to coincide with a campaign or a special date. Once you have started it, you can end the experiment whenever you want or change the variables.
Please note that if your experience is an A / B test, it will be published on all the pages where you have installed Google Optimize, i.e. if you test an element that appears in several parts of your website, it will be seen on all these parts. In the case of specific subdomains, it will only be seen in those subdomains.
Define the audience that sees the test variables
With Google Optimize, you can determine that the percentage of people who see a version of your test is equal between the original version and a variable, i.e. 50% and 50% of people who visit your website see either version; or just assign a higher percentage to one version and give it priority over the others.
It would be best to give all versions an equal proportion, depending on the number of variables you create, that way you can see which one gives you the best results.
Google Optimize randomly chooses which users see one version or another of your experience, and every time they log in, they see the same variable. You can take the test, by logging into multiple computers/sessions and devices incognito to see how your test works.
Case studies and results of experiments with Google Optimize
Case Study 1: Objective> A/B Testing for Improving Blogging Subscriptions
In doing a sensible analysis of my website www.kakablog.net, I find that there are very few calls to action. The concern to keep a uniform design, to ensure that the subscription button has the same background color and which is not very visible, because it has no contrast.
So I created an A/B test, with three variations: the original plus two different versions of the blog’s subscribe button, located in the sidebar. I do this by applying different colors and changing the typeface from light to bold to increase the contrast of the text and better call to action. I also added an extra size to the button to make it more visible.
The distribution of the variants is equal to 33% for the original, 33% for a variant of the button in blue, associated with the colors of the web, and the third variant in orange different from the original web design.
The experiment with the 2 variables was developed over 2 weeks, with the achievement of 42 objectives (subscriptions) out of a total of 2122 site visits.
The result of the experiment is conclusive: remarkably, the orange button does not generate more interaction although it is more visible. Maybe because color has nothing to do with the web and is more associated with a danger signal than a call to action.
Results reports indicate that the blue button and the orange button generated more conversion probabilities (subscription) than the original button, but that the blue button, being more integrated into the web design, generated more conversions.
experiments and a / b test with Google Optimize
Case study 2: Multivariate test (MVT) Objective> Improve blog bounce rate
Another experiment comes from the analysis with the Google Chrome Page Analytics extension which was previously part of Google Analytics and which is now outsourced, it shows you where users click when visiting your website.
With the Page Analytics extension, I was able to analyze that a very small portion of visitors do not click on the category tags or comments at the bottom of each post, due to the low visibility they have. The web design does not generate interest or interaction.
For this, I am doing a multivariable test with Google Optimize. The goal is to improve dwell time, navigation, and bounce rate, changing items to grab the user’s attention and make them click. I also changed the icon color and the category of words and comments to encourage interaction.
For this multivariate test in Google Optimize, I made a variant (highlight the buttons in blue), but with several elements in play. In the experiments, I gave 50% of the traffic to each version, that is – say equal traffic for each version.
When working with multiple elements, the number of changes in this multivariate test is 22 changes between the colors, format, and typography of each element involved.
The experiment took place between April and June 2018, with over 1,487 test sessions of the total number of visits to the website. Google Optimize results reports are rich in data and graphics. We can see that the bounce rate and interaction with experience have improved significantly. It helps me make decisions with my website.
In Google Analytics, I can also see that during this period the time spent, browsing per session, and time spent on the web has improved.
Case studies 3 and 4: multivariate test (MVT) Objective> Improve web subscriptions
These two case studies are summarized in one chapter. The idea is to do Multivariable tests with the Kakablog site. The main goal is to improve the number of conversions and leads.
Before doing the test with Google Optimize, it is important to analyze the page with an interactive tool: a click map. In this case, I used the Analytics page to see which areas users click the most and quickly notice that there are more interactions on the left side of the site than on the right side, where exactly is the “contact” element.
So if we do a test with Google Optimize by changing the color and format element, it would be handy to change its location and move it to the left side of the web.
The experiments and tests that I propose for this site are:
- Change the color of the contact button to a more striking color.
- Include a better call to action by changing the text to “contact us
- Move the “contact” button to the left hemisphere of the web, where there are the most interactions.
Google Optimize allows you to easily change the look and placement of posts, and I did. Once the experiment is launched, we monitor the interactions and analyze the results.
Report results define a variant of Experiment 3, in which we changed the color, text, and location, with better results than the original. The only downside is that adding a new color changes the design and concept of the site, which is black and white since it is an information site.
Case 5: Multivariate test (TMV). Objective> Improve blog subscription
In this experiment, I wanted to make variations on the box and the subscription button of the Kakablog blog, changing the color of the subscription button and the box text.
Segmentation for each of the 4 versions (the original and all 3 variants) was applied equally, giving 25% of the traffic to each of them (without applying any channel segments or traffic type).
The experiment was active for two weeks, considering that the website receives 500,000 visits per month.
These are the 4 versions of the subscription box, taking into account the original subscription box until then. You can see that in addition to the color, I made small variations of the texts.
You have to take into account that, unlike the characters, the size and design of the object change. As you can see in the picture.
In this section, I must clarify that after the implementation of the GDPR, our website had to adapt and modify the subscription form and that it is now different from the examples that I present to you in this article.
The results of the experiment showed that the red box without blue elements was the best result. Statistics show that it takes a higher percentage of conversions even compared to the original.
The other versions, with little margin of difference compared to the original, have a lower performance, as you can see in the following graphic:
As I explained previously, you can synchronize your optimization goals with Google Analytics and see the results of your experiments in the Google Analytics reports, in the Behavior> Experiences area.
Google Analytics shows you the performance of each of the days and variations of your tests with Google Optimize. It’s also a way to analyze your test results based on the day of the week, when you performed the variations, and how it works with your audience.
Case 6: A / B test. Objective> Improve interaction with the contact section
The last experiment is very simple, but just as revealing. Make a different version of the icon and contact section at the top of the Aula CM homepage, changing the color and size from white to red, without changing the layout of the item or template. text.
The experience aims to highlight the element and generate more interest and interaction with visitors and turn them into readers or future students. As this is a very visible experience, the date range was short, only 9 days. Audience segmentation was done at 50% of each version and the experiment ran over 4,277 test sessions.
The results of the experiment are conclusive. The variant of the test, in red, rather than launching a call to action, breaks the graphic unit of the web.
The report shows that the item’s new design never exceeds the conversions generated by the original design, while the original design achieved 50% more conversions during the days it was active.
Practical tips for Google Analytics
Well, I have already shown you many examples and all the functionality of Google Optimize as a test tool. Now I’m going to show you a series of tips that you need to consider when doing your experiments and A / B testing with Google Optimize:
- 1 # Don’t forget to link Google Optimize with Google Analytics, to synchronize your marketing goals on both platforms.
- 2 # Remember that you can link to Google Optimize through Google Tag Manager. It will allow you to apply variables and triggers and have a more complete measurement plan
- 3 # By using Google Optimize, you expand your hypothesis experiments so that when you see the reports and results, you can better measure whether the original goals have been met.
- 4 # Remember to properly segment the audiences who can see the different versions of your website, depending on your assumptions and goals.
- 5 # When experimenting, if possible, let it run for at least two weeks to get more accurate data about user interaction with your site on different days of the week.
- 6 # It is important that, along with your testing and experiences with Google Optimize, you consider the design and visual identity of the brand. Remember that to optimize your page, you must maintain the graphic and corporate unity of a website.
- 7 # Once you think the trial period is sufficient, end your experience. Don’t leave it open. The period of validity of the request will not exceed three months.
- 8 # Conclude and apply them to your website to improve the conversion rate.
Hope you find this post useful. In any case, if you have any doubts, questions, or comments, do not hesitate to write to me; I will be happy to answer you.
Good luck with your marketing campaigns!
