In “Content Marketing”, there is “Marketing”. And who says “Marketing,” says “Data”.
Producing content for the sake of producing content (or just listening to your current inspiration) is not content marketing. It’s a hobby.
You probably already have Google Analytics or an equivalent tracking solution on the platform that hosts your content.
This type of tool can provide you with a lot of very useful information that will guide the production of new content. And help you optimize the content you’ve already written and published.
It would be silly not to help yourself.
In this article, I’d like to share with you my favourite recipes for doing this: the ones I use myself, here on this blog and all the other projects.
I’m assuming that you already have Google Analytics installed on your site to keep up with the content of this article.
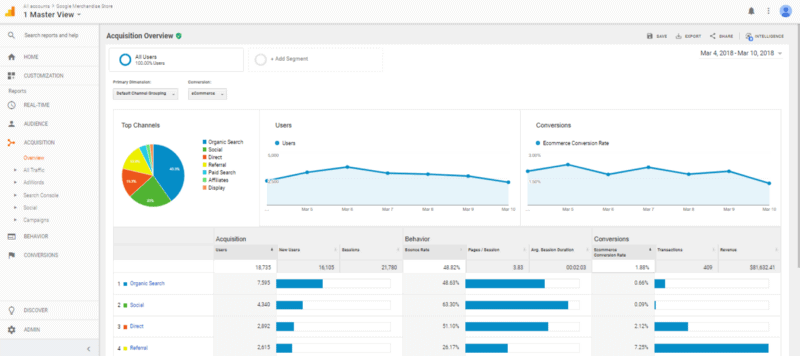
# 01 – The most viewed pages on your site
Fairly obvious, but an important starting point. With a few subtleties that we can easily miss.
I start by taking a look at the “Behavior> All pages on the site” report to get an idea of which pages (all categories combined) get the most views.
And those on which visitors spend the most time.
I kick in an open door (wide open, there is moreover no door and the hinges were blown a long time ago), but you must know your top performers. You need to know your most popular pages in advance.
These are typically pages you need to keep your eye on.
1 / A priori, they are the best candidates to go to work on conversion.
In other words: to optimize the page to increase the chances that the visitor subscribes to the newsletter. Or use the lead magnet you offer. Or visit the page of the site that will speak to him the most, according to his state of mind at the time.
In short: let the visitor do the action you expect from him. Those for which you created this page.
This kind of optimization takes effort and time. Do you prefer to invest them on a page seen by 100 visitors each month? Or on a page seen by 1000?
Identify your top performers to find out where it will be most profitable to focus your efforts.
(Unless, of course, if you’ve already over-optimized the conversion on those pages and need to spend two days to earn 0.1 conversion pts. In that case, move on)
2 / These are the pages that you must have in mind each time you work on new content … to make the internal mesh a success
When you create a new page (at random, a new blog post), it may be to these top performers that you should then redirect your visitor.
You know that your audience is generally fond of the content that your top pages deal with (supporting data).
In theory, then, you have a better chance of keeping the person on your site and of bringing them sooner or later to conversion if you manage to push them towards these top content.
If you have too many “parasitic” pages appearing on the screen
Pages that have nothing to do with your content in the strict sense of the term (the home page, some landing pages, “About” pages or whatever you want to get out of this analysis).
In that case, use Google’s filters to show only the ones that interest you. For example, those that contain / blog / in the URL.
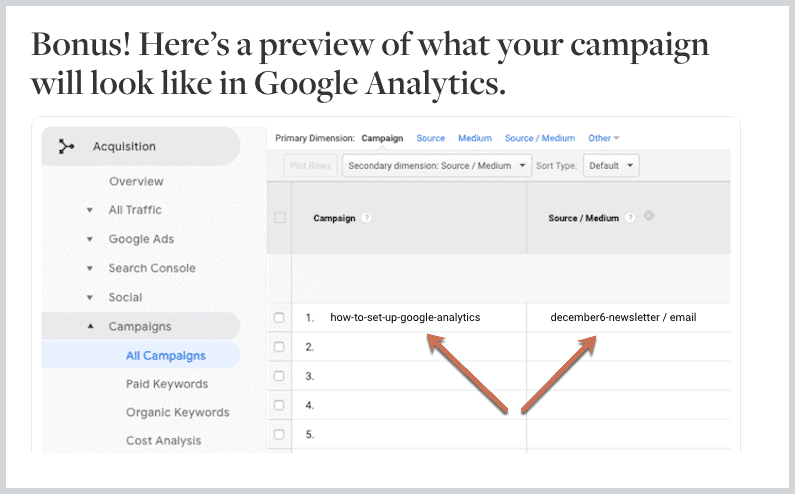
If necessary, combine the filters (or use more advanced functions such as regular expressions) to display only the pages you want to analyze.
# 02 – The least read pages (obviously)
Same report as earlier.
Who are your low performers? The pages, articles and content in which you have invested time, resources and energy but which never get read?
Ok, I understand this is not fun.
Nobody likes to be poked into their failures, a bit like sticking a puppy’s muzzle in the pool of urine they just made in the middle of the kitchen.
But it would help if you made this work.
You need to spot this content. To identify them. Then analyze them to try to understand why they are not seen.
Take your five least read articles and think for two minutes about how you imagine your target will discover them (SEO, social networks, email, etc.). Then analyze this content to understand why the channel you had in mind has failed to attract visitors so far.
Do you rely on email? Resume the emails you use to send this content. Do you have enough subscribers? Are they sufficiently engaged with your content in general? What were the open rates? What were the click-through rates? Etc.
Do you rely on social networks? Same questions, different supports. Evaluate your community and its engagement. Watch the performance of the posts you “pushed” that content into.
Do you rely on SEO? Same logic. What keywords did you imagine the article would be placed on? How much do you estimate the monthly search volume for these keywords? Type these keywords into Google in incognito. What is the average positioning of the article? What is the level of competition in the face?
These micro-audits will already give you ideas on how to improve your low performers.
# 03 – The pages through which visitors entered your site
This is one of the key components of content marketing: bringing visitors to your site.
You just saw “Most viewed pages” on your site.
We will now look at “The pages that visitors enter most often” on your site or blog.
To be sure: can you see the difference?
A page can have a lot of views because it’s a page that visitors to your site go to after they see a few pages.
This does not mean that it is a page through which visitors enter your site; in other words, a page that attracts traffic.
Ok, if that’s clear to you, head to the “Behavior> Landing page” menu.
The work here is the same as the one we just did in the two previous sections.
Who are your top performers? Why? How can you improve the conversion?
Who are your low performers? Why? How can you fix it?
Small subtlety when you go to identify the top and the low.
Don’t just rely on gross visitation volume. Not all pages on your site are intended to attract visitors. Some are there to convert or to engage them after visitors have entered another page on your site.
When you go to identify these tops and bottoms, sort through and analyze only the pages that you had specifically designed to attract traffic and visitors.
Microsoft Excel or Google Sheet can help you a lot on this. Suppose you have a spreadsheet with the list of article URLs that you have designed specifically to attract traffic. In that case, you can use Google Data Studio to “filter” the data from Google Analytics and see only the data of the articles in your list.
# 04 – “The pages through which visitors entered your site”, but this time by channels
Identifying the pages that attract the most traffic to the site is interesting. Still, you have to go further and refine according to the channel (SEO, advertising, newsletter, social networks, etc.)
A simple little trick to find this information in Google Analytics: this time, we go to the “Acquisition> All channels” menu and click on the channel that interests us. Organic, for example. Then we add a secondary dimension: “Landing page”.
Bingo. We now have the complete list of pages visitors entered via SEO.
We will be able to get a much better idea of the articles and content that work in search engines. Find ideas to improve or exploit them further.
Of course, we will have the same thing for low performers, always with the same logic: to go and understand why this content is not referenced or badly.
Then, you will have to do the same work for the other channels that you actively use: emails, social networks, partners and referring sites, etc.
# 05 – The keywords that Internet users have used to arrive on your site
Important information to understand your visitors: their interests, what they are looking for, their state of mind when they land on your site, etc.
Spoiler: Google Analytics censors a little (a lot) of the information available on this subject, but it still exists so you might as well use it.
Go to the “Acquisition” menu, under the “All traffic” and “Channels” menu.
In the right window, we will click on the “Organic search” channel, which will bring up the list of keywords by which Internet users have arrived on our site.
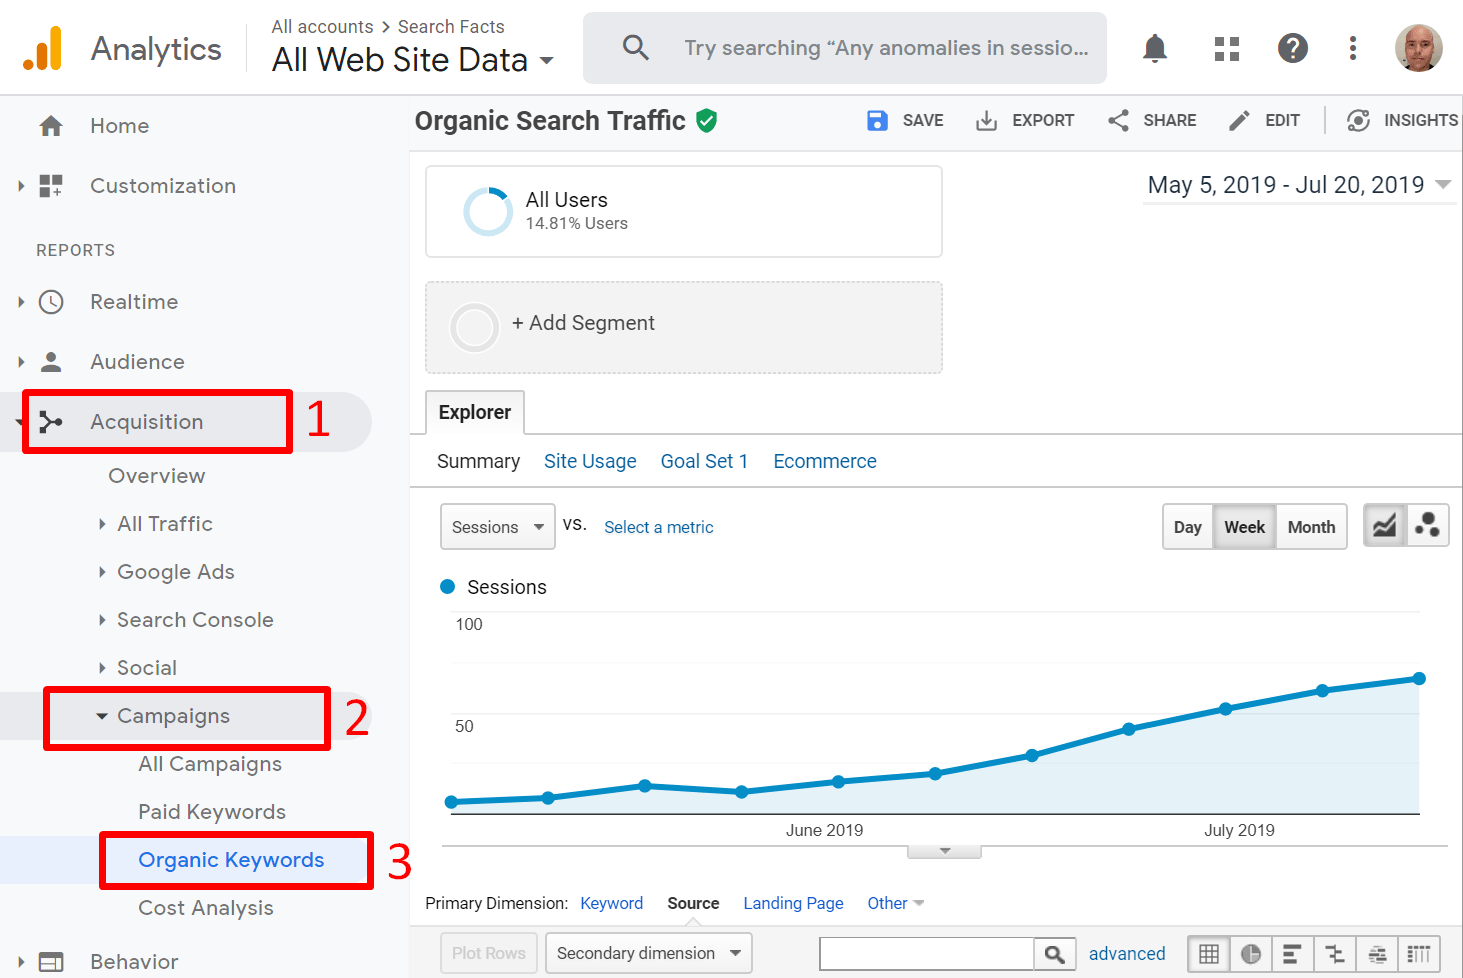
Frustration. You immediately notice that Google Analytics filters almost 98% of the keywords with a “Not provided”.
Officially “to protect the privacy of Internet users” (yes: haha).
No, there is nothing we can do about it.
In the meantime, let’s focus on what we can use.
1 / To begin with, the list of keywords itself
Yes, 98% of the info is filtered, but if we look at the glass half full, that means we have 2% of info to use.
No need to draw a picture: I imagine you can see the applications very well.
This list will help you discover keywords that “work” and drive traffic to your site.
Maybe also keywords you did not necessarily target in your content, but which attract visitors. In other words: good ideas for optimizing existing content (by digging into these topics) or creating new content.
Suppose you have an SEO tool (Ahref, SEMrush, Ubersuggest, etc.). In that case, these keywords are a thread that you will be able to draw on to find other keywords, refine your SEO strategy, evaluate the monthly search volume keywords you haven’t worked on yet, etc.
Finally, you might spot some trends that emerge from these keywords that could inspire you for your next content (“If my visitors are looking for X, then there must be a lot of searches on Y”)
Before we move on to the other two methods of identifying keywords through Google Analytics, let’s take an (out of curiosity) look at the pages visited based on the keywords.,
Examine the pages visited for each keyword
We will go and display the list of pages on your site through which the visitors who entered these keywords entered.
To do this, add (still in the same menu) a secondary dimension “Landing page”.
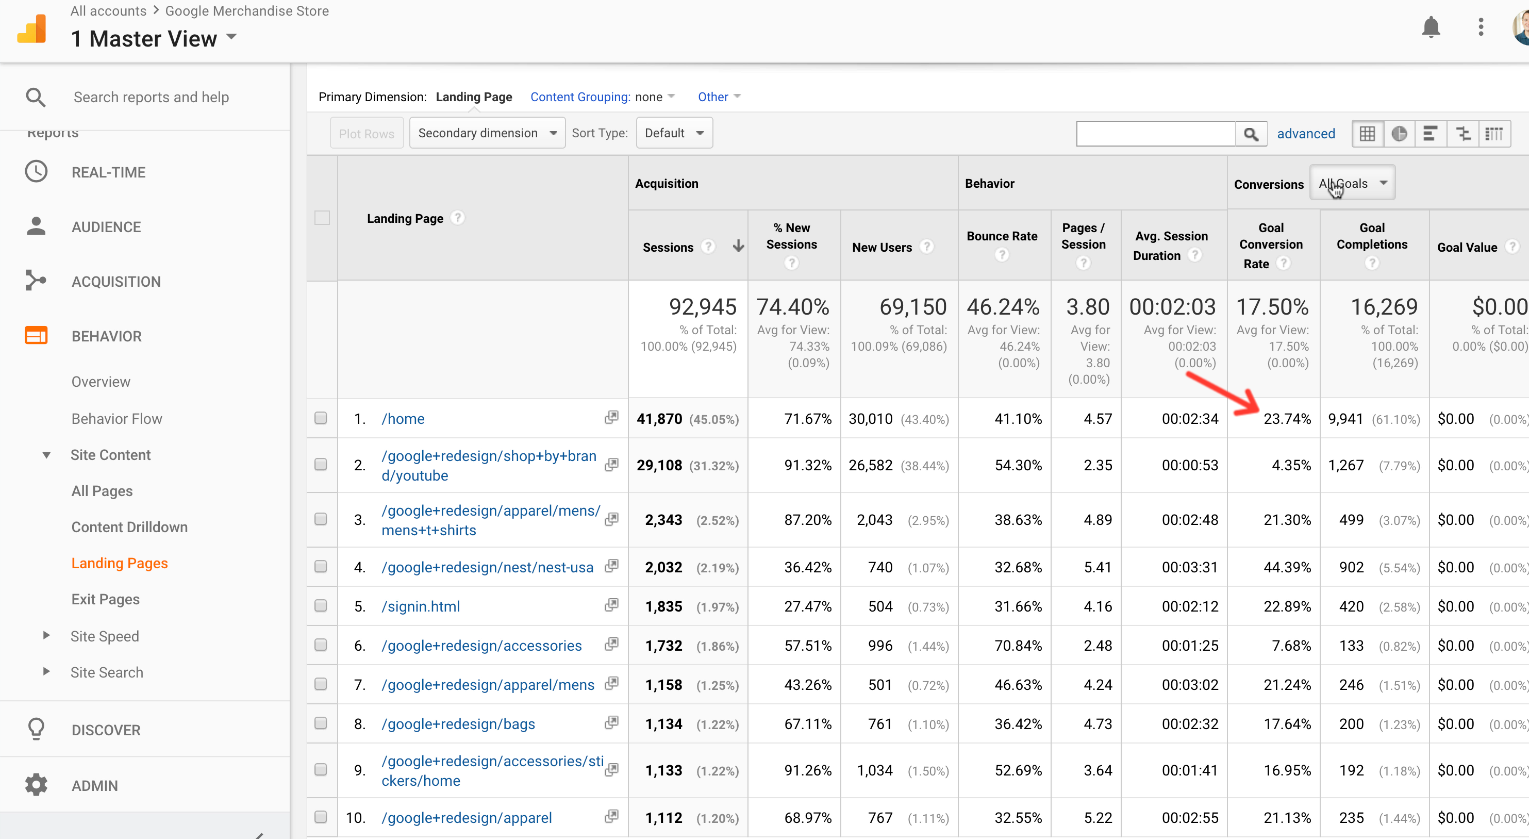
In order to filter the results a little, to make them as readable as possible, we will immediately filter this “not provided” which is useless to us.
All you need to do is do an advanced search and exclude all keywords containing “not provided”.
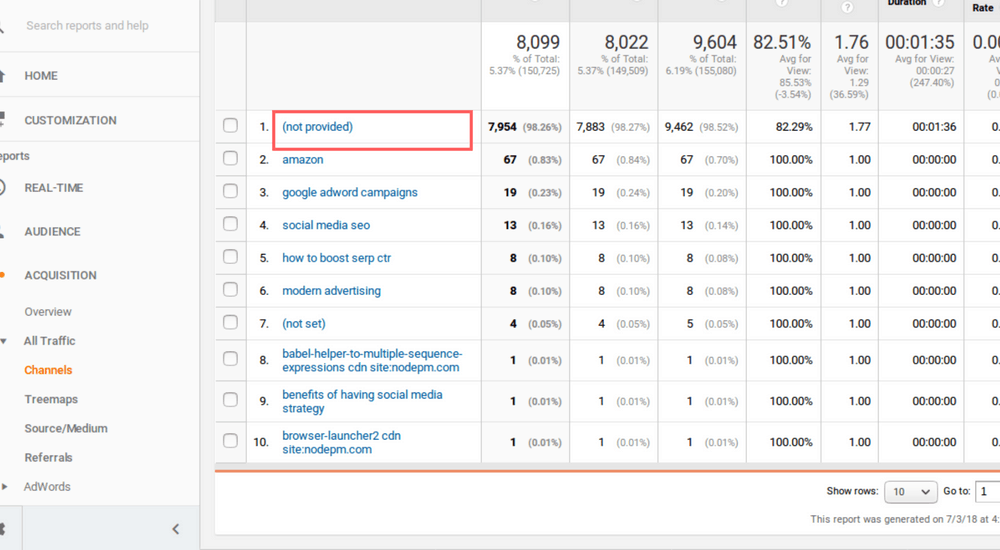
And hop! Here is the list of keywords and corresponding pages.
Yes, yes: you will come across a lot of fairly obvious results: such keyword = such page.
But I think you are also going to have some surprises.
- Pages that attract traffic that they shouldn’t (“This is page X that was supposed to attract visitors. Why is this page Y going up?”)
- Pages that capture visitors that you had not expected (“Hey, it’s funny: we also attract Internet users who seek information on Y. We should perhaps dig more into the subject in the article. Or create a dedicated page.”)
Let’s go back to the other two solutions for finding keyword ideas via Google Analytics.
2/Connect Search Console to your Google Analytics account
The Search Console (formerly “Google Webmaster Tools”) is a bit like the little sister of Google Analytics. It is a free, online tool offered by Google that gives you more control over how your site appears in search engine results.
As a webmaster, this is a service that you have every interest in using.
And as a content marketer, it’s in your best interest to link it to your Google Analytics account.
Warum?
Because this will allow you to reconcile data present in the two services.
For example, you will be able to see the number of times that one of your pages has appeared in the search engine results.
Not just “The number of times a user has seen it and then visited your site” (as Google Analytics can see). No, you will be able to see the number of times it has appeared in the results when a user has searched.
I imagine you already see the possibilities.
A page appears often, but it is rarely clicked?
Let’s optimize the title and description. Or maybe find other keywords to place yourself on.
Another very useful info: the average positioning of your page in search results.
You even have a menu by keywords (well, sorry, “by query”) with again the average position of your site for said keywords, the number of times the page appeared in the search results and the number of times a user has clicked to go to your site.
Possibilities, possibilities …
To find all this information in Google Analytics, go to the “Acquisition” menu, then to the “Search console” sub-menu. And finally, follow the instructions to link your Google Analytics account to your Search Console account.
A little tip that I like
Look for pages that have an average placement between 10 and 20.
(Understand by this: “The pages which are often found on the second page of Google results”)
What for?
Because these are the most tempting pages for a quick wins session.
If these pages are found on page two of Google, that means that they generate enough interest and are qualitative enough to appear in Google… but they still lack a little something to end up on the first page.
Go check out the competition on the keywords you are targeting with these pages and see if you can optimize them to make them go up a bit further.
3 / See what your visitors type in the search bar on your site
If you use content marketing, you’ve probably posted enough content to justify adding a search bar to your site.
History of helping your visitors to find more easily the contents which interest them.
Well, Google Analytics allows you to use this information.
To begin with, see the list of terms that visitors have typed into the search bar.
The only downside is that you must have configured this option in your Google Analytics account. It is not retroactive: it will only start collecting information once you have it in place.
Once you have completed this configuration, you can find this information in Google Analytics in the “Behavior> Site Search” menu.
You will have both the list of the most searched terms, but also the pages that appear most often in the results of your search bar.
The list of terms most searched by your users should tell you about your visitors’ expectations and interests (maybe even give you ideas for content to create on topics you haven’t tackled yet).
Or, more prosaically, alert you to little strange search results … like pages that your search bar rarely offers to visitors when the keywords entered by them indicate that they might interest them.
By improving these pages, you should improve the user experience on your site… and maybe also understand what can slow down their ranking in Google.
If enough visitors are using your site’s search bar, you could even create a segment to specifically analyze visits with a search (“Site Search Status” Contains “Visits With Site Search”).
And analyze the behaviour of Internet users who search for this term. (= What pages do they visit? Do they convert? Etc.)
# 06 – Visitors who convert (or who micro-convert)
A conversion = The visitor performs on your site the action that you expect from him. Buy a product. Subscribe to your service. Submit a quote request. Click on an advertisement or an affiliate link.
In short: the reason why you set up this site. The final goal.
A micro conversion = The visitor, has just carried out a significant action which brings him closer to the moment when he will carry out this action.
He placed a product in the basket. He created an account. He signed up for the newsletter. He downloaded a white paper in exchange for his email address. He clicked on a Call To Action at the end of a blog post to see the pricing page.
In short: you have succeeded in hiring him.
Google Analytics allows you to track these conversions through two features.
In fact, for me, these are the two most important features of the tool: objectives and events.
The downside is that both of these features need to be configured.
Installing Google Analytics on your site by adding the default tracking code is not enough.
You need to explain and describe to Google Analytics these important actions (conversions and micro-conversions) that you want to track.
But to summarize these items, we can say that the objectives are major actions you expect your users, your conversions,
While events allow you rather track down micro-conversions (I’m enlarging the line, but you get the idea).
Once you have declared these objectives and these events in your account, you will be able to find new information in almost all the interfaces of Google Analytics: the impact on the objective.
Let’s go back to one of the examples we saw in the article: the list of pages through which visitors entered your site.
Once you’ve set up the goals, you’ll find some juicy new information on this screen.
For each page through which visitors enter your site, you will be able to see the percentage of these same visitors who then achieve your goal (= that is, the action you expect from them.)
Example: you will see that page A brings you 1000 visitors per month, but that only 3 of these visitors have then converted.
While page B brings you 200 visitors per month, but 65 of those visitors have converted.
The events themselves have stored somewhere a little more discreet Google Analytics. But they allow you to track more advanced actions.
The downside is that to use events; you have to know how to use a little code or go through an external service like Google Tag Manager.
A concrete example of the use of Objectives and Events
This point being particularly important, I allow myself to drive the point home with a concrete example of use.
One of the keys if you use content marketing is not to produce content for the sake of producing content. Or for the sake of generating traffic.
It would help if you made sure that the content you are producing is contributing to the goals you have set for yourself.
Let’s say your objective is to generate leads, that is to say, to obtain contact details of potential customers, interested in your offer and whom you will be able to canvass.
So you want the content you are going to post on your site to serve to attract qualified visitors and convert them into leads.
Google Analytics will allow you to make sure that each agreement that you have published plays its role.
Very concretely, let’s imagine that you sell a subscription to an online service that helps HRDs improve the skills of the company’s employees.
So you need your content to attract HRDs potentially interested in this kind of solution.
In order, you want these visitors:
A / Find out about you through blog articles you publish on the subject.
- “XXX, HR Director of the YYY company, tells about the implementation of the skills training plan.”
- “7 concrete ideas for your managers to encourage their managers to improve their skills.”
- Etc.
B / That they interact with this content and that eventually, they leave you their contact details.
Be actively signalling that they are interested in your solution (= They read the article, appreciated the content, inquired about your solution, wanted to know more, we completed the demo request form)
Either by passively signalling that they have precisely the problem that your solution addresses (= they downloaded a resource like a .pdf that you make available to them for free in exchange for their email address … which allowed you to automatically send behind several other emails, to provide them with additional content, until they actively contact you )
In Google Analytics
One solution would be to create an event that is triggered each time a visitor clicks on a call to action in an article (to go to a guide for example or to go to the demo request form).
And create a goal that triggers every time a demo request form has been submitted.
You will be able to look article by article (in the “Behavior> Landing page” menu mentioned above) to check that this content has the impact you expect from it.
# 07 – Examine the geographical origin of visitors
Google Analytics allows you to know where (geographically speaking), your site visitors are coming from. By continent, by country, but even by region and city.
Great. So what?
The info may not be useful to you if you are targeting a local audience. But if you market your offering nationwide, you might have some surprises.
“Huh? But what is he talking about? What a surprise? We have an office in Chicago. We have three-quarters of our traffic coming from there. And the rest distributed between governed
Minute. Why is there a peak like that coming from Brittany? Is it punctual?
Ha, no. It has been constant for a year. Oh. And it’s not just traffic; it’s conversions too. But what…”
The explanation after some research: one of your business developers is precisely from Brittany.
He comes back regularly to spend a few days with his family, and he takes the opportunity to do some promotion of the company.
Nothing major: just a few small actions here and there. Short reflexes when he thinks about it and sees an opportunity pass.
- He spoke about your business to several of his acquaintances, who relayed the information around them
- He participated in a trade fair during which he met more than a dozen potential clients
- He put a local journalist (one of his acquaintances) in touch with the CEO who had graciously agreed to answer a few questions and the company found itself featured in a local daily.
In short: it has accumulated, over time, small actions that have gained an audience.
Strokes of luck. Opportunities seized at the right time.
But maybe more to go and find.
If it is, it is worth making a synthesis of the actions that he carried out and which obtained results.
With the necessary resources, you may be able to replicate these actions in another region. Imagine that by investing a few days of work, you manage to increase local traffic in the long term significantly.
# 0 8 – Identify the effects of seasonality on traffic
Another practical utility of Google Analytics for the pragmatic content marketer: identifying the effects of seasonality on your audience. To stay ahead of peaks and drops in traffic, but also to better anticipate subjects.
Are there months of the year when traffic is naturally low? Or high?
Changes during the month? Even the week?
This information will not be very useful a priori if your site attracts little traffic and you are struggling to collect a few hundred visitors per month.
But once you have passed the threshold of a few thousand visitors, it becomes important to ask yourself the question.
A / If you rely on content to generate business, you need to know exactly the times of the year when activity is slowing (or increasing).
You are likely (like the vast majority of websites) to experience lows… for example, in December and August.
You must anticipate this drop in your traffic forecast (and if you have exceeded a certain audience size, I strongly hope that you have a traffic forecast plan).
Don’t count on 9,000 visitors in August, 10,000 in September, 11,000 in October, 12,000 in November and 13,000 in December.
B / You must be able to anticipate periods when the web takes an interest in your theme to prepare yourself on time.
If you see a peak in traffic every year in October for whatever reason and rely on SEO to ride that wave, you’re probably going to want to do it in March, time to create the content and index it.
C / If you use social networks a lot, the data on your Google Analytics account may be able to help you identify the best timing to share content on the networks (day of the week and time).
# 09 – Collect actionable information to adjust the website to mobile behaviour
What percentage of your visitors are viewing your site from a mobile device?
Does a mobile visitor have the same chances of converting as a desktop visitor?
The classic scenario in Content Marketing: your visitors use their phones to find information on the fly. And once they find the information they are interested in, they leave your site and never come back.
Not only are you not hitting your conversion goal, but you are not even able to trigger a micro-conversion (such as newsletter signup) that would allow you to continue the relationship.
If this is the case on your site, it might be worth considering which articles suffer the most from this effect during mobile sessions.
To do this, create a segment in Google Analytics to limit traffic to visitors browsing your site from a mobile device. Then resume the same reports that we saw earlier in the article.
And once you’ve spotted the problem articles, it’s up to you to open the article in question on your mobile and think about what you can optimize.
Is the article too long? Micro-conversion is too late? Can it not be used on mobile? The interface of the site does not go to mobile at all? Is the page too long to load? Are there too many requests on the screen (pop-up, inserts, welcome mat, etc.)?
One last tip to finish: don’t be one of the lazy or cowards.
I hope this article has been helpful to you. I’ll leave you with one last piece of advice.
Over the past ten years, I have encountered two types of profiles in marketing when it comes to using data.
Those who don’t use it enough. And those who do too much.
Those who do not use data enough like to repeat that content is, above all, a question of creativity. Inspirational. And that we can not let the muse parasitize by Excel spreadsheets.
They usually have a fable or two under their belt to come out and explain to you how much they are above these basics.
“Nah, but you know, data is just an indicator. Don’t take that into account too much, eh.”
Some will even get you the quote from Cheryl Mckinnon (“Live in the market, not in the spreadsheet.”) Which they will happily misinterpret.
It is for me a sign of laziness (= laziness to train or to research) or of ego (= “I am an artist. I know the truth intuitively“).
Conversely, those who use too much data will trip over data and never act.
They may spend much more time examining, analyzing and understanding than is necessary. And this will come at the expense of the time they should spend producing content relevant to their audiences and their goals.
They will never dare to go for it because such keyword does not have enough monthly search volume to merit content. Because such and such a page does not attract enough visitors to justify starting to work on conversion.
And, by looking too much at the data, they risk killing their creativity and stifling that little inner voice that we all have and that inspires us with good ideas: truly original ones that have a chance to surprise our audience.
There is a balance between laziness and cowardice. You have to find it. Be pragmatic.
